Electrocardiogram
The ECG has a wide array of uses:
- Determine whether the heart is performing normally or suffering from abnormalities (eg. extra or skipped heartbeats - cardiac arrhythmia).
- May indicate acute or previous damage to heart muscle (heart attack) or ischaemia (reduced blood supply) of heart muscle (angina).
- Can be used for detecting potassium, calcium, magnesium and other electrolyte disturbances - which affect nerve impulses.
- Allows the detection of conduction abnormalities (heart blocks).
- Can provide information on the physical condition of the heart (eg: left ventricular hypertrophy, mitral stenosis).
An ECG is made by measuring the voltage between various points of the body. There are twelve leads in total. Each, by its position, record information from particular parts of the heart. When the heart beats nerve impulses in the muscles cause small positive and negative charges in the body.
Understanding the shape of graphs of depolarization and repolarization
yields important diagnostic information.
The right ventricle
has very little muscle mass. It leaves only a small imprint on the ECG, making
it more difficult to diagnose than changes in the left ventricle.
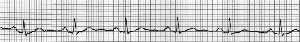
The normal ECG

Drawing of the ECG graph, with labels of waves P=P
wave, QRS=QRS complex, T=T wave.
P- wave
The P wave is the electrical signature of the nerves that causes contraction of the atria. Both the left and right atria contract simultaneously. Irregular or absent P waves may indicate arrhythmia.(irregular heartbeat).
QRS
The QRS complex corresponds to contraction of the left and right ventricles, which is much more forceful than that of the atria and involves more muscle mass, thus resulting in a greater ECG deflection.
The Q wave, when present, represents the small current as the nerve impulse travels through the centre of the heart between the ventricles. Very wide and deep Q waves indicate myocardial infarction.(heart attack)
The R and S waves indicate contraction of the ventricle muscle. Abnormalities in the QRS complex may indicate ventricular abnormalities.
T wave
The T wave represents the relaxing of the ventricles. The QRS complex usually obscures the atrial relaxing wave so that it is not usually seen. Electrically, the cardiac muscle cells are like loaded springs. A small impulse sets them off, they depolarize and contract.
In most leads, the T wave is positive. (although a negative T-wave is normal in black people).
The ST segment connects the QRS complex and the T wave. It can be depressed if there is a reduced blood supply to the heart and elevated in myocardial infarction (heart attack).
Representation in culture
In various television medical dramas, an isoelectric ECG (no cardiac electrical activity or flatline) is often used as a symbol of death or at least extreme medical peril. This is technically known as asystole, a form of cardiac arrest with a particularly bad prognosis